[:ja]前回は放射性廃棄物を安全になるまで長期間保存する前段階として 30年から 50年程度の短期間の貯蔵,中間貯蔵があるという話をしました.今回はそのお話です.
放射性廃棄物とその中間貯蔵までのまとめ
ここまでで最終処分の対象とする放射性廃棄物とはどのようなものか,放射性廃棄物はどのように発生するのか,最終処分の前までに,どのように処理をするのかの現状について概要を見てきました.現在ではコストなども考えた実用的な核種変換技術がないために,放射性廃棄物を長期間保存する方法が現実的と考えられています.次節では,その放射性廃棄物の特性についてもう少し詳しく見ていきます.それを知ることで最終処分の課題が見えてくるでしょう.
使用済み核燃料の放射能減衰の推移
放射能減衰の推移グラフ
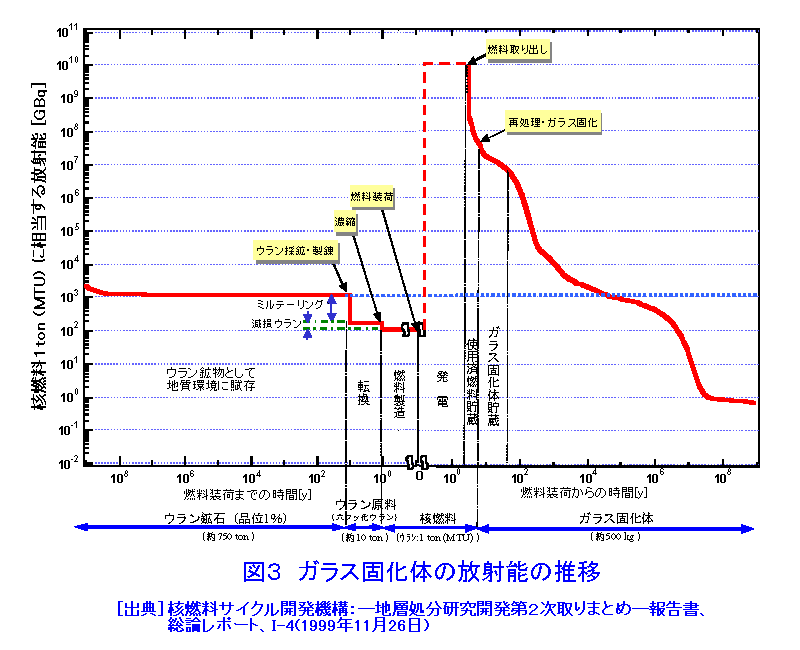
使用済みの核燃料は,原子炉から取り出された時には高い放射能を持っているために,これを保管して放射能が落ちるのを待つ必要があります.勉強会ではここで放射能減衰の推移グラフが示され,減衰には長期間かかることが示されました.
やまうちメモ
使用済みの核燃料は,いつまでこれを保管する必要があるのかが問題になります.使用済みの核燃料が数ヶ月程度で安全なレベルにまでなるのであれば,最終処分もおそらくあまり問題はないのですが,そういうわけにはいきません. 次の図は使用済み核燃料の放射能減衰の時間推移を示しているものです.これは一般財団法人高度情報科学技術研究機構の資料[1]でみつけたもので,核燃料サイクル開発機構の資料が出典となっています.
図 3.の読み方:
まずはこのグラフの読み方をみていきましょう.グラフが両対数のグラフになっていることに注意して下さい.とは言ってもまず,両対数グラフとは何かの話をしたいと思います.それは縦軸も横軸も指数となっているようなグラフで普通のグラフとはちょっと違います.よく見慣れたグラフでは,1目盛り進むと +1 増えますが,ここにあるグラフではたし算ではなくかけ算で,1目盛り進むと 10 倍になります.つまり,2目盛り進むと 100 倍になるグラフです. 縦の軸ですが,核燃料を取り出した直後には核燃料 1 トンに相当する放射能がベクレル値で 1010 GBq となっています.1010 とは 1 の後に 0 が10 個つくという意味ですから,10000000000,つまり 100 億のことです.そして単位の Bq の前にある G というのはギガという単位につく補助の接頭辞で,109を示します.コンピュータに少し詳しい方であれば,GByte が,MByte の1000倍ということをご存知でしょう.するとこれは10億であることもご存知かもしれません.すると,1010 GBqというのは,100億ギガベクレルで,10000000000000000000 Bq,つまり,1000京ベクレルのことです. 政府の基準では,核種や食品にもよりますが,目安として食品は 1 kg あたり100 ベクレル以上のものは摂取しない方が良いということですから,核燃料を取り出した直後のベクレル値は,私には想像すら難しいレベルです. そして横軸にはほぼ中心に核燃料を使用しはじめた時点の 0 があります.右側に行くと時間が経過しています.ここで,軸の目盛りをみると,100年, 102年,104年, 106年,108年,と続いています.10 の指数の数は先程の GBqの時と同じく,0 がいくつ1の後に続くかと同じことですから,100年は 1 年,102年は 100年, 104年は 10000年(1万年),106年は100万年,108年は1億年の意味です. グラフをみると横に青の点線が引かれています.これが「ウラン鉱物として地質環境に賦存」と書かれている時の放射能を示している線です.赤の線がこの線を横切るのにかかる年月は,104 と 105 の間あたりですから,1万年から10万年の間ということが読み取れます.これでグラフの読み方がおわかりになると,嬉しいです. ところで,上記で数字の 100 と 1000京を比較するのは公平ではありません.食品は 1kg あたりの Bq で核燃料の場合には 1t あたりの Bq ですから,核燃料の方が数字が大きくなります.1t は 1000kg ですから,100 と 1京 の比較が公平です.こうやって数字を 1000 倍違うように見てしまうこともあります.報道でも,時々このように単位をそろえていないことがあります.ただし,普通,単位は言っているので間違いではありません.(しかし単位をそろえても 100 と 1 京はとても違います.) こういうとても大きさの異なる数を,指数を使って 0 がいくつつくのかということで示す方法を科学的表記法と言います.この場合 100 は 1 の後に 2 個の 0 があるので,102, 1 京(10000000000000000) は 1 の後に 0 が 16 個つくので,1016 です.(どうです? 指数は便利でしょう) 単位を変化させて表現にインパクトを与えるのは広告では普通にあります.たとえば,広告では○○ 1000 mgなどと言いますが,それは○○ 1gと同じです.広告の戦略としては 1000 という数の方が 1 よりもずっとインパクトがあるので正しいですし,何も間違いではありません.それならば,○○ 100万マイクログラムと言うこともできます.これも 1g のことで何も変わっていませんが,100万までいくと怪しくなるので 1000 mg を考えた人は広告の才能があるなと思います.広告の場合にはまったく問題はないと思いますが,放射能汚染などの数値の報道では,単位には少し気をつかって欲しいと思います.
使用済み核燃料はいつまで保管しなくてはいけないか
先の図 3 ですが,Web 上を探すと一般財団法人高度情報科学技術研究機構以外にも似たような図がみつかります.ただ,後で私は気がついたのですが,この図が示すのは,ウラン鉱を採鉱した時点まで放射能が下がる時間が数万年単位ということであって,ウラン鉱を採鉱した時点での放射能の強さが危険なのか安全なのかについてとは関係がありません.この図を見せて頂いて,時間がかかるんだなあ,という印象を持ちました.しかし,勉強会の後にふと思ったのは,ではその数万年を越えたら安全なのか? ということです. 図3では青い点線は燃料 1トンあたり 1000 GBq 相当,つまり 1GBq/t (=10億ベクレル/t) を示します.考えてみればギガベクレルというのはかなり大きな値です.相当する放射能という言葉がどのような定義かに疑問がありますが,それを置いておくことにして 1kg に換算すると MBq/kg ですから,100万ベクレル/kg です.日本でのいくつかの食品の安全基準は,100 ベクレル/kg 以下というので,その1万倍というのはかなり大きな値のように思います. 結局青の点線以下になれば,人間が近付けるのかどうかなどは私にはわかりません.やはりどうしても安全かどうかということに関心があるので,何か図をみたらそう判断できないかと考えてしまうのが悪いのかもしれません.そのような意味では,この図は単に燃料を作った時と同じレベルの放射能の強さにかかる時間がどの位かということ示しているだけである,安全性とは関係はない,と考えるのが良いかと思います.
放射能減衰の推移と対処
図 3 から,核燃料を取り出した際の放射能は 100億GBq/t,それを3〜5年の燃料貯蔵プールで冷却した後には,数千万 GBq/t,その後ガラス固化体として 30〜50 年の中間貯蔵後には 1千万 GBq/t を少し下回るレベルになっています.これが天然にあるウラン鉱石の放射能レベルの線,1000GBq/t となるまでにはさらに数万年が必要です.この中間貯蔵以降の保管が最終処分となりますので,次回にその方法を見ていきましょう.
次回
次回はようやく最終処分の方法についてみていきます.数万年を越える期間何かを保存するというのは私には気が遠くなる話です.そもそもそのようなことはできるのでしょうか?
参考文献
- 高度情報科学技術研究機構, 高レベル放射性廃棄物と処分対策の安全問題, ガラス固化体の放射能の推移の図表を参照, (http://www.rist.or.jp/atomica/data/dat_detail.php?Title_Key=05-01-01-03 ), accessed 2015-7-1
[:en]We talked about what is the nuclear waste, how it is generated and what kind of process we need to do in order to put it in a final disposal storage. Since we still do not have a practical (cost effective) nuclide conversion technology, the most practical method to render nuclear waste innocuous is its long term management. In the next section, we will review the property of nuclear waste. That will bring up what kind of problems we have with the final disposal of waste.
Transition of used fuel radioactive decay
A chart of radioactive decay over time
When used fuel is taken away from a reactor it is highly radioactive. Thus we need to store it in somewhere and wait for the radioactivity to become lower. At the meeting we saw a radioactivity attenuation chart, which shows that it takes a long time.
Yamauchi’s memorandum
How long do we need to store the used fuel? If we only need to store the used fuel for a few months and the radioactivity level became low enough, nuclear waste management might not be a big issue. However, it is not so easy.
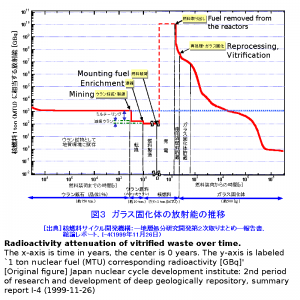
Figure 3 shows the radioactivity attenuation of used fuel over time. You can find this chart at the web site of Research organization for Information Science & Technology (RIST) [1], that refers to the web site of Japan nuclear cycle development institute asthe source of the data.
 Figure 3: Radioactivity attenuation of vitrified waste over time. The x-axis is time in years, the center is 0 years. The y-axis is labeled `1 ton nuclear fuel (MTU) corresponding radioactivity [GBq]’
[Original figure] Japan nuclear cycle development institute: 2nd period of research and development of deep geologically repository, summary report I-4 (1999-11-26)
How to read Figure 3:
Let me show you how to read this chart. First, please notice the graph scale is log-log. What does this mean? Both axes of a log-log graph are described by exponent. You may be familiar with a linear graph. In a linear graph, one tick of an axis means usually +1 (or +n), but one tick of this chart is × 10. For example, one tick of this chart means ‘times ten’ instead of ‘plus one’. If you go two ticks, the value increases 100 times more.
The vertical axis shows the radioactivity in Becquerel. When the used fuel was taken from a reactor, the radioactivity indicated 1010 GBq/t.
1010 means 10 zeros after 1. Therefore, it is 10000000000, which is 10 billion. The character ‘G’ (Giga) before the unit `Bq’ is a SI-prefix, and it means 109. If you are familiar with computers, you know the memory size is represented as GBytes, which is 1000 times larger than MBytes. This means, 1010 GBq is 10,000,000,000 GBq = 10,000,000,000,000,000,000 Bq = 10 quintillion.
According to the criterion of the Japanese government, though it depends on nuclide and food, we should avoid eating food with an activity of more than 100 Bq per kg. Compare to this number, radioactivity of the used fuel is enormous. It seems beyond my imagination.
There is the 0 on the x-axis at the center of the graph. This is the time when the fuel is first used. To make Uranium useful as fuel, it is enriched, i.e., its radioactivity is increased. As we go to the right, time passes. The axis ticks increases 100 years, 102 years, and so on.
The exponent number of 10 has the same meaning as in the last example about Bq, how many zeros after the 1. This means, 100 years is one year (zero zeroes after 1), 102 years is 100 years, 104 years is 10,000 years, and 108 years is 100,000,000 years.
The graph shows a horizontal blue dotted line. This line shows the radioactivity when Uranium ore is in a mine. The cross point of the red line and the blue line is between 104 and 105 years. Therefore, it takes about 10000 to 100000 years until the radioactivity of used fuel reaches the level of naturally occurring Uranium ore.
By the way, it is unfair to compare the 100 Bq/kg for food and 10 quintillion Bq/t for used fuel. Note that the units are different: Bq/kg and Bq/t. This means that radioactivity of 1 Bq/kg is 1000 times higher than 1 Bq/t. Therefore a fair comparison is between 100 Bq/kg for food and 10 quadrillion Bq/kg for used nuclear waste. We sometimes miss the unit difference. Sometimes we could find these units are not consistent in some news articles. The different units are not technically a mistake, but it is still misleading. When we use the same unit here, 100 and 10 quadrillion are quite different.
These large numbers are hard to see. We do not know what 10 quintillion or 10 quadrillion are. Scientist usually use the scientific notation to write these numbers. The scientific notation uses exponent. In other words, this is how many zeros are in the number. 100 has two zeros after one, in exponent writing this is 102. 1 quadrillion is 10,000,000,000,000,000. This has 16 zeros after 1, it is 1016. Many advertisements use large numbers since they have a high impact when heard. For example, a sport drink in Japan claimed that was an 1000 mg effective medicine dosage, but this has the same effect as 1g of medicine dosage. Still, 1000 has makes an impression on us, so it is a good advertisement strategy. This is fine for an advertisement, however, I recommend to be careful about units an article about radioactive contamination for the news.
How long shall we keep the used nuclear fuel?
If you search about radioactivity attenuation of nuclear waste (Figure 3) you find many similar figures on the Web. I later realized that this figure only shows it takes more than 10 thousand years for the used fuel radioactivity to decay to the same level of an Uranium mine. I found nothing about the safety of the level of an Uranium mine. My first impression was, “wow, at least 10 thousands years, that’s a long time!” But I never asked the question: “is it safe after 10 thousands years?”
The blue line in the figure indicates 1000GBq/t, which means 1GBq/t (one billion Bq/t). 1 GBq/t is quite a large radioactivity value. Though one thing is not clear here that in the explanation, “1 ton nuclear fuel (MTU) corresponding radioactivity [GBq]”, I assume that this unit means GBq/t. If I convert it to Bq/kg, this is 1000 MBq/kg, that is 1GBq/kg, and this is 10 billion Bq/kg. As we mentioned before, the recommendation of safety for food is 100 Bq/kg according to Japanese government, and a value that is 10 million times larger does not safe to me.
I do not know what is blue line in Figure 3 means. Can I safely get near to some radioactive substances if the level is lower than this blue line? As a citizen, I am more interested in safety, so I try to connect this figure to safety, but this is not even labelled as radioactive dosage. I think this figure only shows the relationship between time and radioactivity attenuation, but that is not related to safety.
Progress of radioactive decay and waste management
Figure 3 shows the progress of radioactive decay over time. When the fuel is taken out of the reactor, its radioactivity is 10 billion GBq/t. After three to five years of cooling down in the fuel water tank, it becomes a few tens of million GBq/t. Then, after 30 to 50 years the radioactivity of vitrified waste in interim storage becomes a bit less than ten million GBq/t. Until the radioactivity drops to the level of a Uranium mine, we need to wait approximately ten thousand years. The final disposal process starts after the interim storage stage. Let’s see what is planned for that.
References
- Research Organization for Information Science and Technology (RIST: 高度情報科学技術研究機構), “Safety problems of high level nuclear waste and its processing (高レベル放射性廃棄物と処分対策の安全問題), note: the decay graph of vitrified waste can be accessed from this page)”, http://www.rist.or.jp/atomica/data/dat_detail.php?Title_Key=05-01-01-03, [Online; accessed 2015-7-1]
[:]

